> ## Documentation Index
> Fetch the complete documentation index at: https://docs.brewit.ai/llms.txt
> Use this file to discover all available pages before exploring further.
# Charts
> Learn how to create, customize, and manage charts within Brewit.ai to visualize your data insights.
**Visualize Your Data** With Brewit.ai, transforming your data into
informative charts is straightforward. Discover how to bring your data to life
through visualization.
## Introduction
Charts in Brewit.ai are dynamic visual representations of your data, designed to help you understand trends, patterns, and outliers. With a variety of chart types and customization options, you can create visualizations that best suit your analysis needs.
## Creating a Chart
To create a chart, follow these steps:
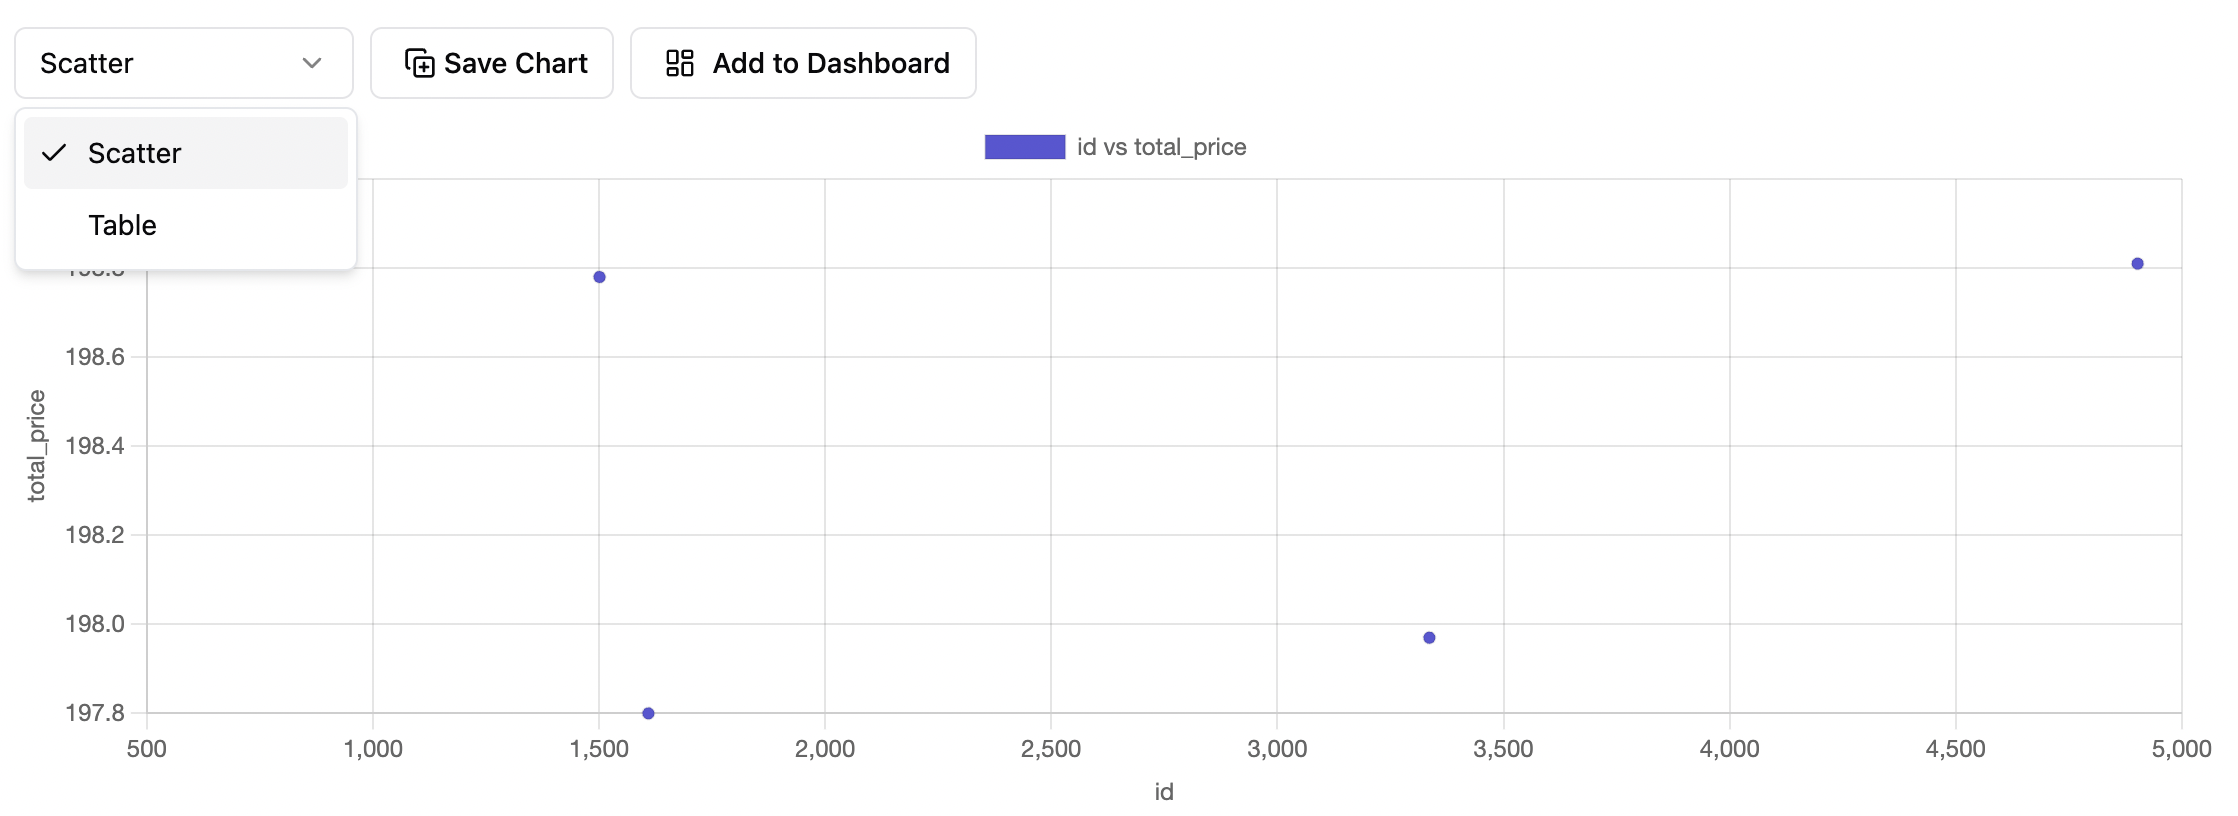
On the home screen, select a data source and ask any questions about your
data
Select the type of chart that best represents your data. Click **Save
Chart** button to save the chart for future reference and add it to any
dashboards.
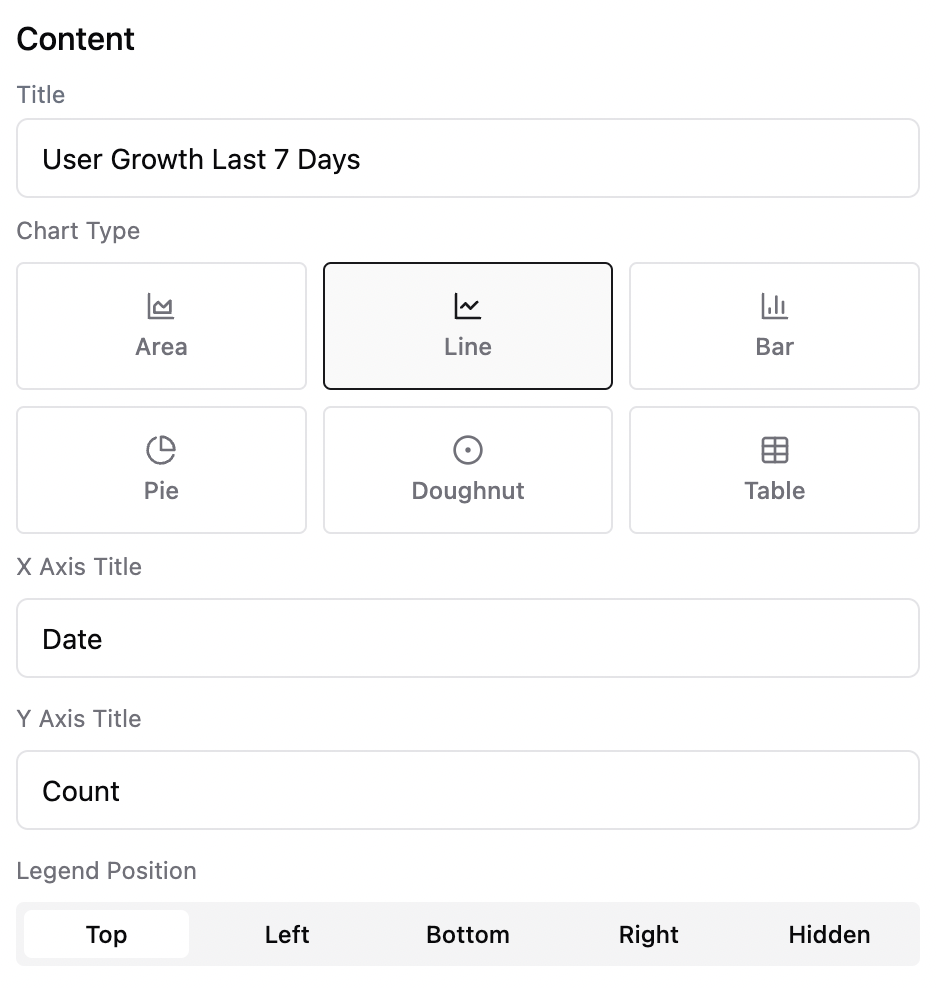
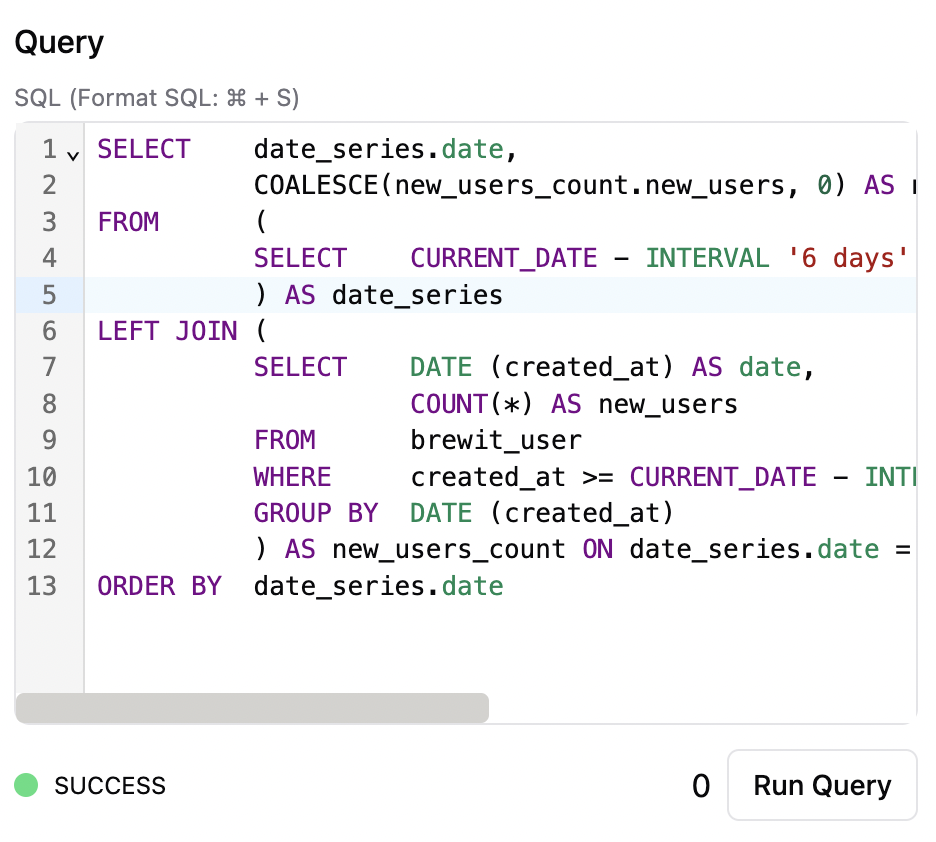
 Navigate to [Dashboards](https://app.brewit.ai/dashboards) tab and customize your chart's appearance based on the data structure or update SQL query to extract the data you
wish to visualize.
Navigate to [Dashboards](https://app.brewit.ai/dashboards) tab and customize your chart's appearance based on the data structure or update SQL query to extract the data you
wish to visualize.
 ### Supported Chart Types
### Configurations
* `X Labels`, `Y Labels`, `Z Labels`: Labels for the chart axes.
* `Legend Position`: Position of the legend on the chart.
* `Font Size`, `Prefix`, `Suffix`: Styling options for single value charts.
### Supported Chart Types
### Configurations
* `X Labels`, `Y Labels`, `Z Labels`: Labels for the chart axes.
* `Legend Position`: Position of the legend on the chart.
* `Font Size`, `Prefix`, `Suffix`: Styling options for single value charts.