Visualize Your Data With Brewit.ai, transforming your data into
informative charts is straightforward. Discover how to bring your data to life
through visualization.
Introduction
Charts in Brewit.ai are dynamic visual representations of your data, designed to help you understand trends, patterns, and outliers. With a variety of chart types and customization options, you can create visualizations that best suit your analysis needs.Creating a Chart
To create a chart, follow these steps:1
Chat with Brewit
On the home screen, select a data source and ask any questions about your
data
2
Choose Chart Type & Save Chart
Select the type of chart that best represents your data. Click Save
Chart button to save the chart for future reference and add it to any
dashboards.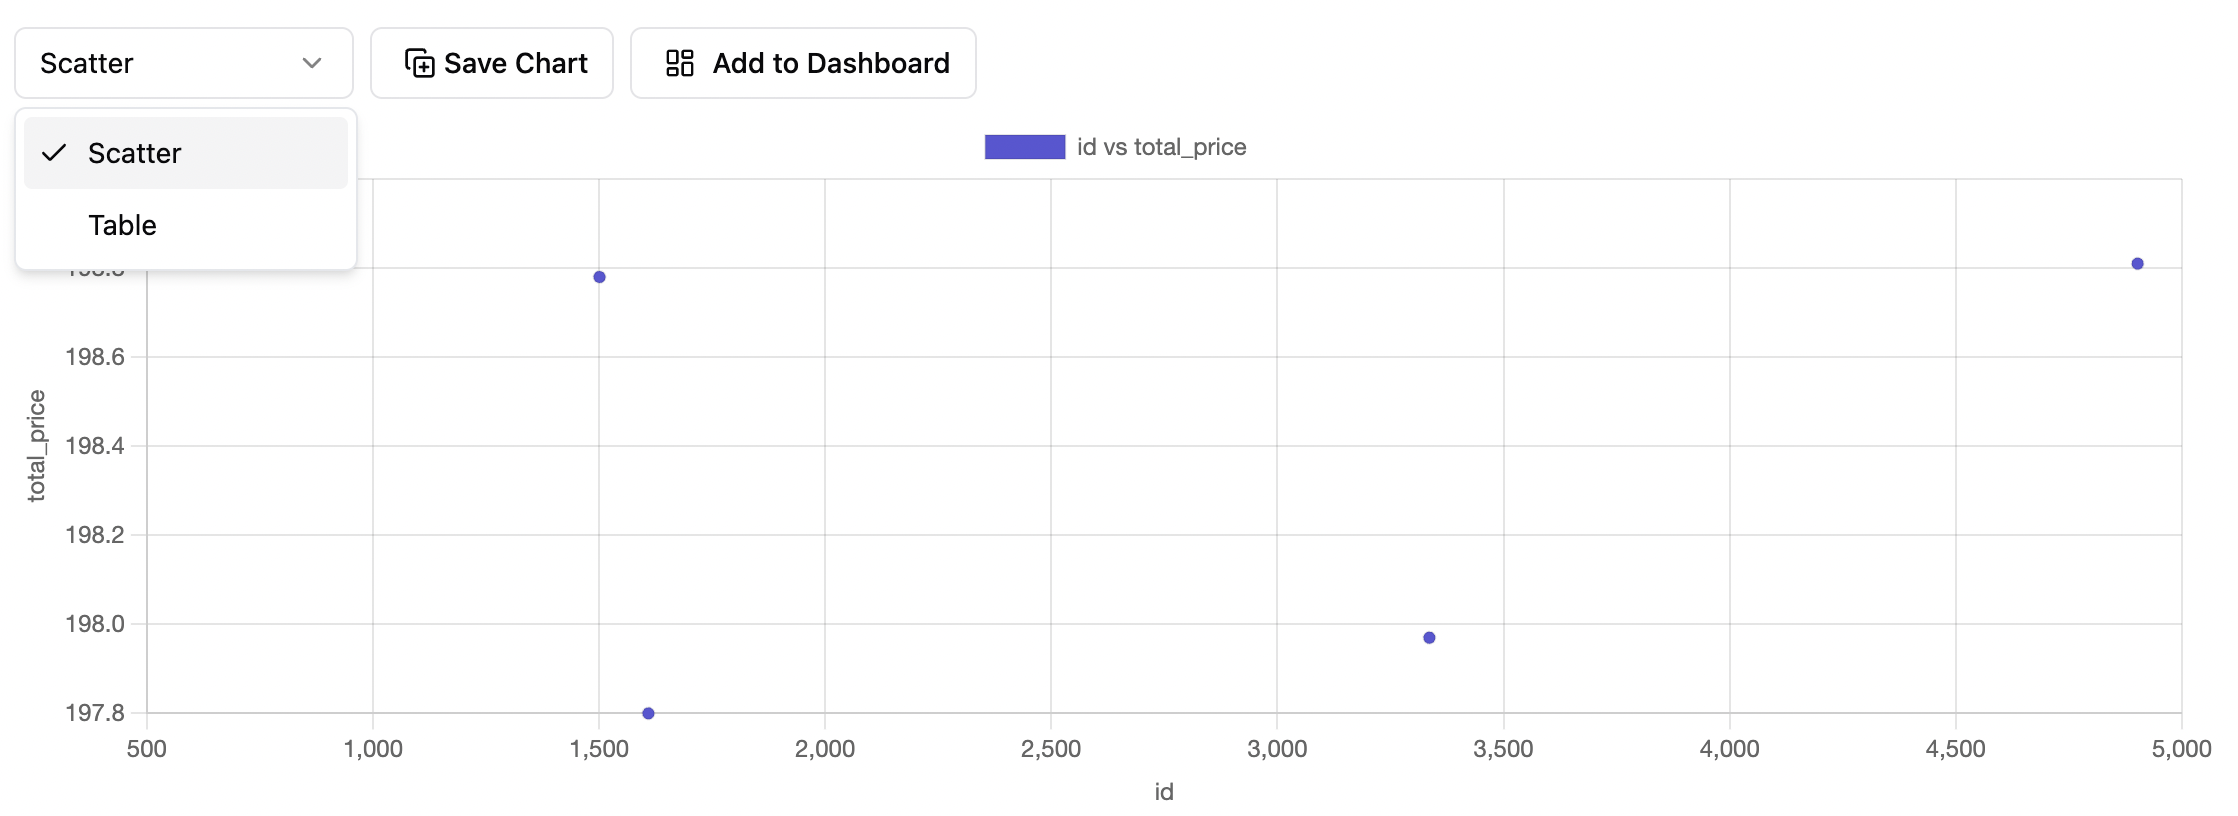
3
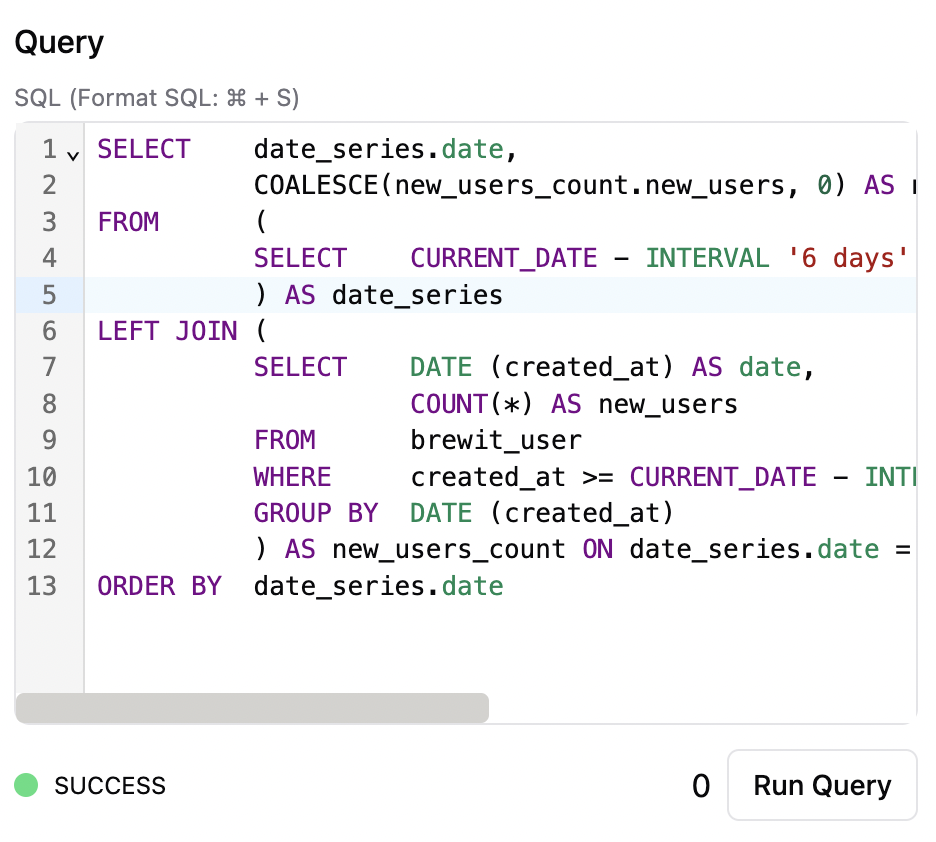
Customize Chart
Navigate to Dashboards tab and customize your chart’s based on the data structure or update SQL query to extract the data you
wish to visualize.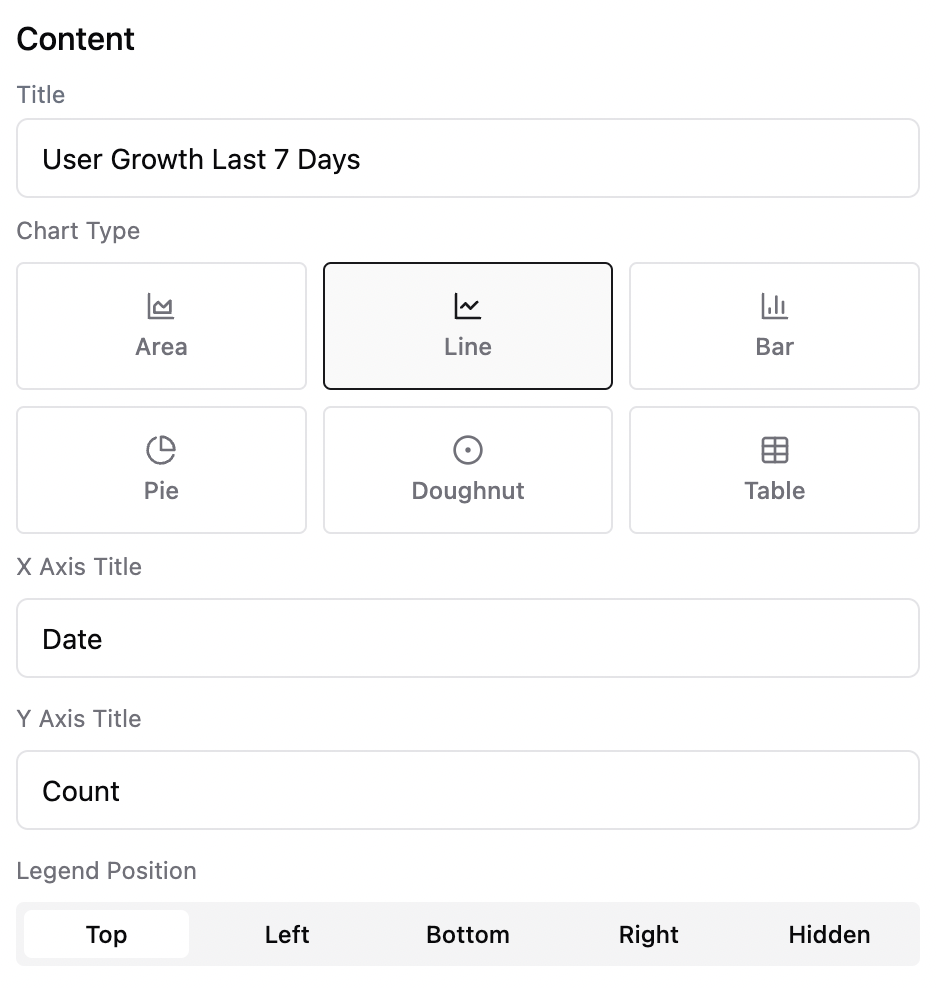
Supported Chart Types
Line
Area
Step
Bar
Pie
Doughnut
Scatter
Funnel
Table
Single Value
Configurations
X Labels,Y Labels,Z Labels: Labels for the chart axes.Legend Position: Position of the legend on the chart.Font Size,Prefix,Suffix: Styling options for single value charts.