Centralize Your Insights Dashboards in Brewit.ai provide a flexible
platform to aggregate your data visualizations, enabling you to monitor and
share key metrics at a glance.
Introduction
Dashboards are a powerful feature in Brewit.ai that allow you to organize and display charts, markdown blocks, and links in a customizable layout. Whether you’re tracking KPIs, project progress, or data analysis results, dashboards offer a centralized view of your data.Creating a Dashboard
Creating a dashboard involves selecting charts, configuring layout options, and customizing appearance settings to suit your needs. Follow these steps to start building your dashboard:1
Define Your Dashboard
Initiate the creation of a new dashboard by specifying a title, description,
and the type of dashboard (e.g., Dashboard or Report) you wish to create.
2
Add Charts and Blocks
Incorporate various types of blocks, such as charts, markdown for narrative,
and links for external resources. Click the 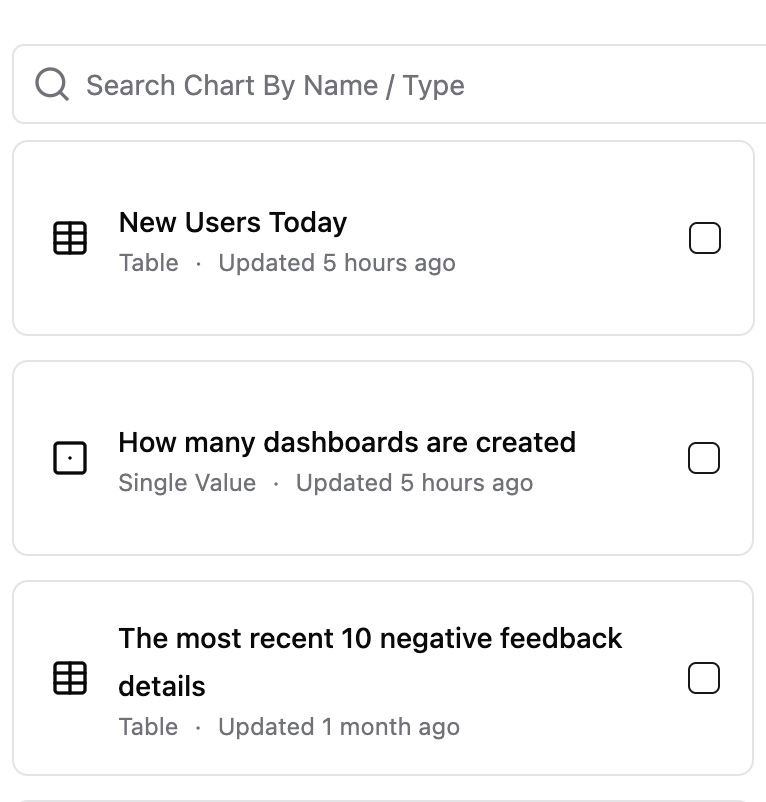
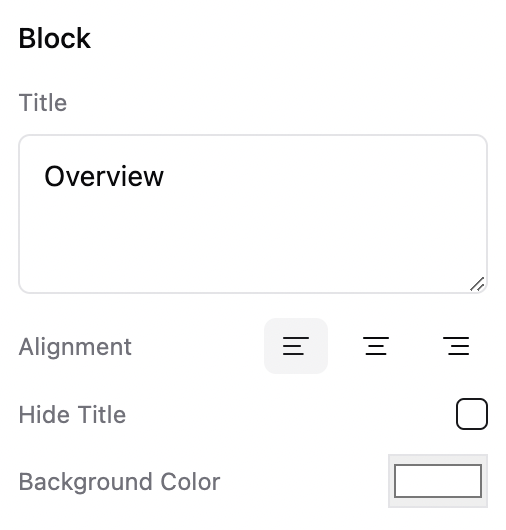
Chart button you’ve created or
use the updated chart features for enhanced visualization options.3
Customize Layout
Arrange and resize blocks within your dashboard. This step is crucial for
ensuring your dashboard is organized in a way that best communicates your
data story.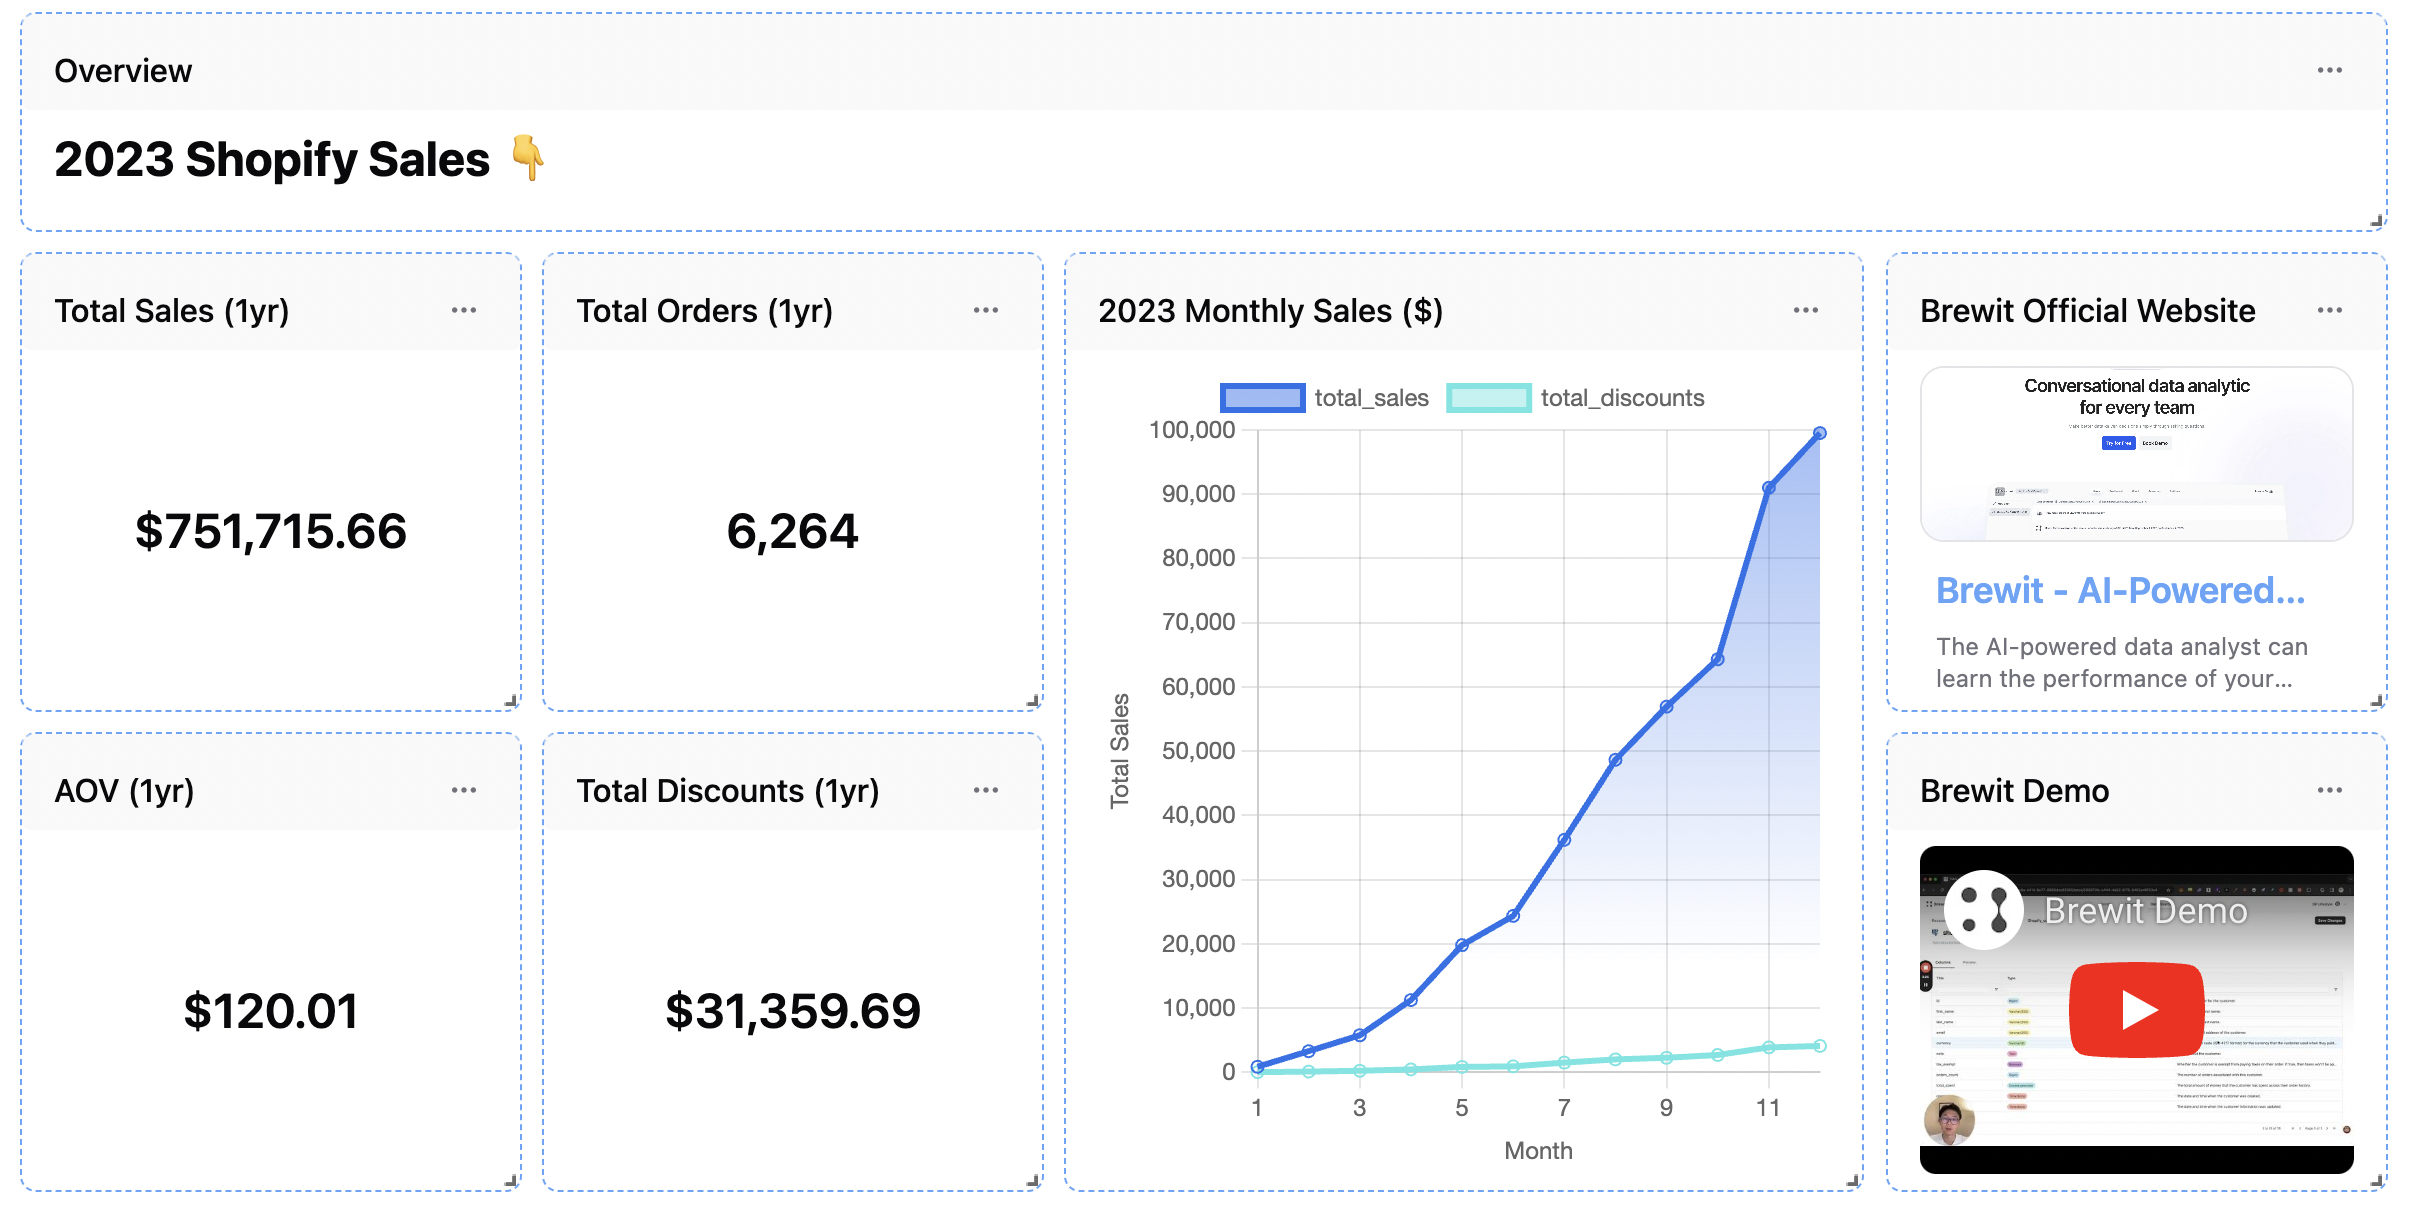
4
Set Properties
Finalize your dashboard by setting properties such as background color.
These aesthetic adjustments can enhance readability and viewer engagement.
Mode
Customizing and managing your dashboards is straightforward in Brewit.ai:View Mode
View Mode
Switch to view mode to see how your dashboard appears to others, helping you
ensure that the layout and content are perfectly aligned with your
objectives.
Edit Mode
Edit Mode
Enter the edit mode to rearrange blocks, update chart configurations, or
modify dashboard properties.
Fullscreen Mode
Fullscreen Mode
Use fullscreen mode for presentations or to focus on dashboard insights
without distractions.
Data Refresh
You can manually refresh your dashboard to ensure that you’re viewing the most recent data. However, dashboards are not updated in real-time, due to the potential performance impact on the underlying data sources.Sharing and Collaboration
Dashboards are designed for collaboration. Share your dashboards with team members to provide them with valuable insights, or use shared dashboards as a discussion point in team meetings and strategy sessions. You can also change the access to public or internal.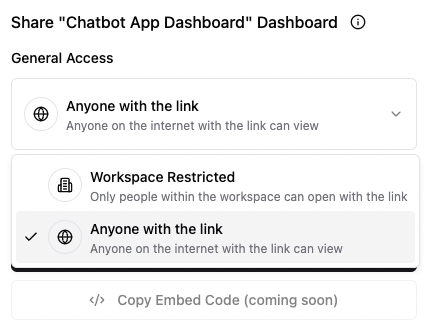
Everyone now in the workspace can view and edit the dashboard.